The histogram above represents the scores of some candidates in an examination. (a) Using the histogram, construct a frequency distribution table indicating...
Question 1 Report
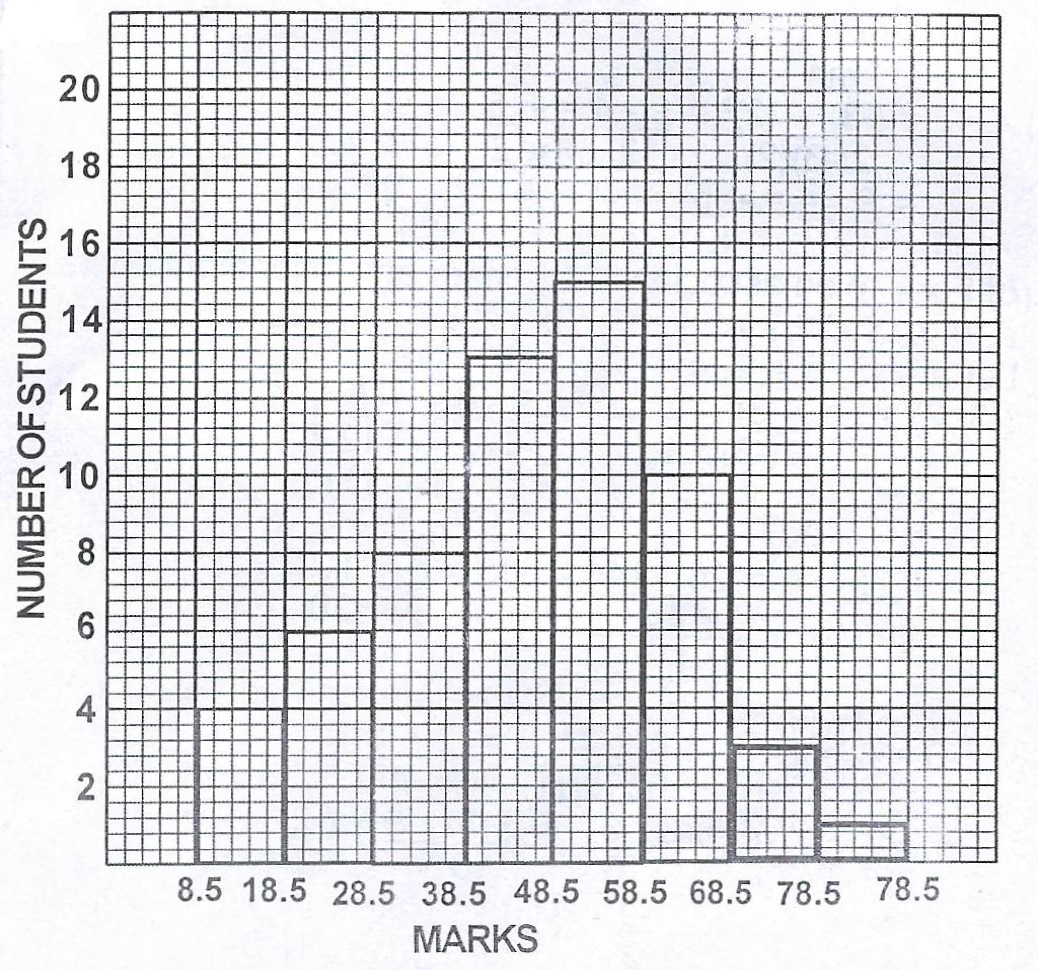
The histogram above represents the scores of some candidates in an examination.
(a) Using the histogram, construct a frequency distribution table indicating clearly the class intervals ;
(b) Draw a cumulative frequency curve of the distribution and use it to estimate the :
(i) median ; (ii) quartile deviation.
Answer Details
(a) Frequency distribution table
| Score | Frequency, \(f\) |
|---|---|
| 9–18 | 4 |
| 19–28 | 6 |
| 29–38 | 8 |
| 39–48 | 13 |
| 49–58 | 15 |
| 59–68 | 10 |
| 69–78 | 3 |
| 79–88 | 1 |
| Total | 60 |
(b) Cumulative frequency curve
| Upper class boundary | Cumulative frequency |
|---|---|
| 8.5 | 0 |
| 18.5 | 4 |
| 28.5 | 10 |
| 38.5 | 18 |
| 48.5 | 31 |
| 58.5 | 46 |
| 68.5 | 56 |
| 78.5 | 59 |
| 88.5 | 60 |
Plot the cumulative frequencies against the corresponding upper class boundaries to obtain the less-than ogive shown below.

(i) Median
\[\frac{N}{2}=\frac{60}{2}=30.\]
From cumulative frequency 30, the score read from the ogive is
\[\boxed{\text{Median}=48.4}\]
(ii) Quartile deviation
\[Q_1=\frac{N}{4}=15\text{th score},\qquad Q_3=\frac{3N}{4}=45\text{th score}.\]
From the ogive, \(Q_1=35.5\) and \(Q_3=57.5\).
\[\text{Quartile deviation}=\frac{Q_3-Q_1}{2}=\frac{57.5-35.5}{2}=\boxed{11.0}.\]
Download The App On Google Playstore
Everything you need to excel in your exams
