The histogram above represents the scores of some candidates in an examination. (a) Using the histogram, construct a frequency distribution table indicating...
Question 1 Report
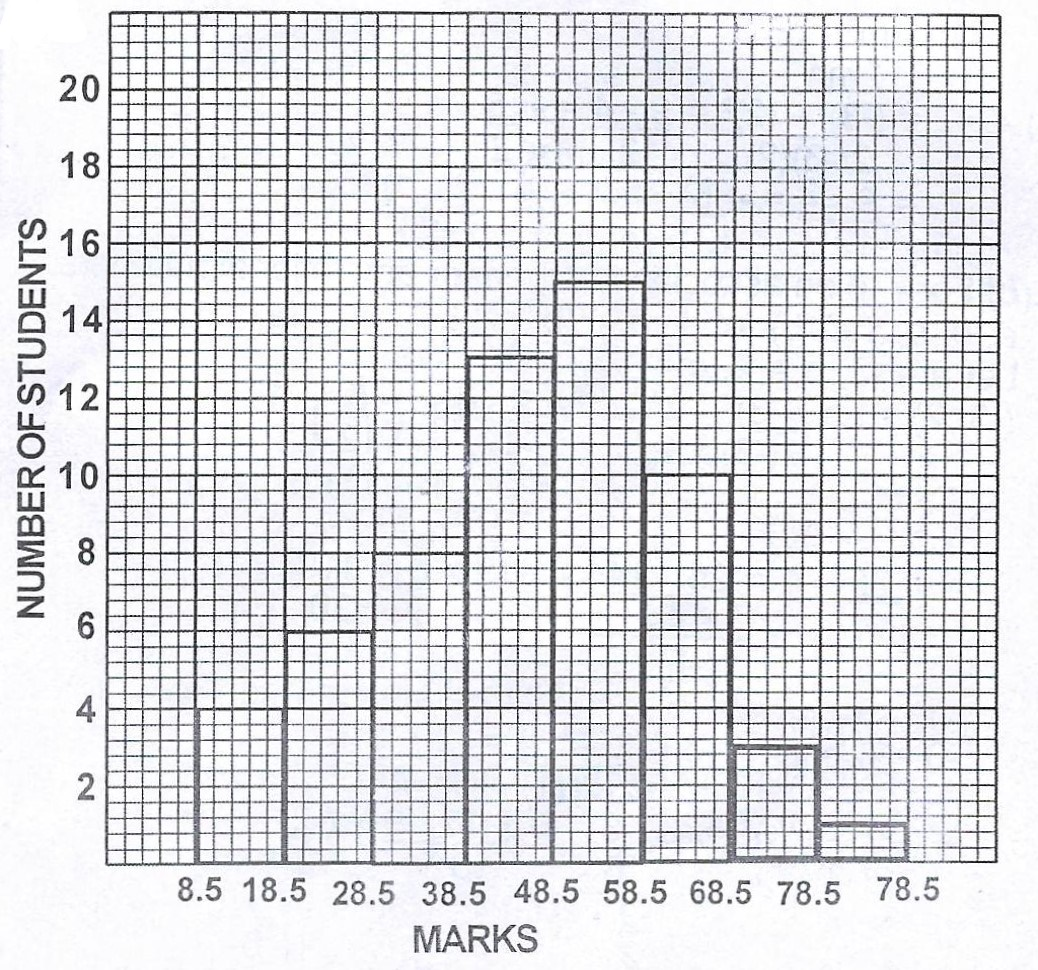
The histogram above represents the scores of some candidates in an examination.
(a) Using the histogram, construct a frequency distribution table indicating clearly the class intervals ;
(b) Draw a cumulative frequency curve of the distribution and use it to estimate the :
(i) median ; (ii) quartile deviation.

Download The App On Google Playstore
Everything you need to excel in JAMB, WAEC & NECO

Personalized AI Learning Chat Assistant
Thousands of JAMB, WAEC & NECO Past Questions
Over 1200 Lesson Notes
Offline Support - Learn Anytime, Anywhere
Green Bridge Timetable
Literature Summaries & Potential Questions
Track Your Performance & Progress
In-depth Explanations for Comprehensive Learning