Here is a problem: Country A has a GNI per capita of $45,000, but its infant mortality rate is 28 per 1,000 live births. Country B has a GNI per capita of $6,500, but its infant mortality rate is only 4 per 1,000. Which country is more developed?
If you picked Country A based on income alone, you fell into a classic exam trap. If you hesitated because the health data contradicts the wealth data, you are already thinking like a geographer. Development is never captured by a single number, and the Cambridge IGCSE Geography (0460) examiners know it.
This topic appears with high frequency across Paper 1 and Paper 2. It demands precision with indicators, spatial awareness of global patterns, and the ability to evaluate strategies for closing the development gap. These IGCSE Geography revision notes walk through every syllabus objective, step by step. Every section follows a logical sequence: define the concept, apply it with data, then evaluate its strengths and limitations.
Section 1: Measuring Development
What Does "Development" Actually Mean?
Development is the process by which a country improves the economic, social, and environmental well-being of its population. Two related but distinct concepts sit at the core of this definition:
- Standard of living: the material wealth and comfort available to a person or household, measured through income, access to goods, and housing quality.
- Quality of life: a broader measure that includes health, education, freedom, safety, and environmental conditions alongside material wealth.
A country can have a high standard of living (high incomes, plenty of consumer goods) but a lower quality of life if, for example, air pollution is severe, inequality is extreme, or personal freedoms are restricted. This distinction is essential for exam answers that ask you to "assess" or "evaluate" development.
Economic Indicators of Development
Economic indicators measure a country's wealth and productive output. Here are the ones the IGCSE syllabus requires:
| Indicator | Definition | Strengths | Limitations |
|---|---|---|---|
| GDP (Gross Domestic Product) | Total value of goods and services produced within a country in one year | Widely available data; allows direct comparison between countries | Does not account for population size; ignores income distribution |
| GNP (Gross National Product) | GDP plus income earned by citizens abroad, minus income earned by foreigners within the country | Captures overseas earnings (important for countries with many workers abroad) | Still ignores distribution; can be skewed by a few very wealthy individuals |
| GNI per capita (Gross National Income per person) | GNP divided by total population | Accounts for population size; most commonly used income measure | Hides inequality. A GNI per capita of $20,000 could mean most people earn $20,000, or it could mean a few earn $200,000 while most earn $2,000 |
Social Indicators of Development
Social indicators capture dimensions of life that income alone misses. These are the ones you need:
| Indicator | What It Measures | High Value Means |
|---|---|---|
| Life expectancy | Average number of years a person is expected to live from birth | Better healthcare, nutrition, sanitation (more developed) |
| Literacy rate | Percentage of adults who can read and write | Better education system (more developed) |
| Infant mortality rate | Number of babies who die before age 1, per 1,000 live births | A HIGH value = poor healthcare, so HIGH = less developed |
| Calorie intake per person per day | Average daily food energy consumption | Better food security and nutrition (more developed) |
| Doctors per 1,000 people | Number of qualified physicians relative to population | Better healthcare provision (more developed) |
The Human Development Index (HDI)
The HDI was created specifically to address the problem we opened with: no single indicator tells the full story. It is a composite measure, scored from 0 to 1, combining three dimensions:
- Health: measured by life expectancy at birth
- Education: measured by mean years of schooling and expected years of schooling
- Income: measured by GNI per capita (adjusted for purchasing power parity)
A score closer to 1.0 indicates higher human development. Norway, for example, typically scores around 0.96. Niger scores around 0.39.
The HDI's strength is that it forces a multi-dimensional view of development. Its limitation is that it still uses averages, which hide inequalities within a country. It also omits factors like environmental quality, political freedom, and personal safety.
Worked Example 1: Comparing Countries Using Multiple Indicators
Problem: You are given the following data. Determine which country is more developed and justify your answer.
| Indicator | Country X | Country Y |
|---|---|---|
| GNI per capita (US$) | $42,000 | $3,800 |
| Life expectancy (years) | 79 | 56 |
| Literacy rate (%) | 99 | 61 |
| Infant mortality rate (per 1,000) | 5 | 68 |
| HDI | 0.92 | 0.47 |
Step-by-step reasoning:
- Compare GNI per capita: Country X ($42,000) is far wealthier than Country Y ($3,800). This suggests Country X has a higher standard of living.
- Compare life expectancy: Country X (79 years) has a 23-year advantage over Country Y (56 years), indicating superior healthcare and nutrition.
- Compare literacy rate: Country X (99%) versus Country Y (61%). Country X has a far more educated population.
- Compare infant mortality rate: Country X (5 per 1,000) versus Country Y (68 per 1,000). Remember, a LOWER infant mortality rate means better development. Country X is significantly stronger here.
- Compare HDI: Country X (0.92) versus Country Y (0.47). The composite score confirms the picture from individual indicators.
- Conclusion: Country X is more developed across all five indicators, both economic and social. Country Y likely classifies as a low-income country with significant challenges in healthcare and education.
Factors Affecting Quality of Life and Standard of Living
Several interconnected factors determine a population's quality of life:
- Employment opportunities: access to well-paid, stable jobs
- Access to healthcare: hospitals, clinics, trained medical staff, affordable medicine
- Access to education: schools, trained teachers, affordable or free tuition
- Clean water and sanitation: piped water, sewage systems, waste management
- Political stability and governance: rule of law, absence of conflict, corruption levels
- Environmental quality: clean air, safe neighbourhoods, green spaces
- Infrastructure: roads, electricity, internet access, transport networks
Section 2: The World Is Developing Unevenly
The Global Pattern: LICs, MICs, and HICs
The World Bank classifies countries into three broad income groups:
- LICs (Low-Income Countries): GNI per capita below approximately $1,135. Many are in sub-Saharan Africa and parts of South Asia. Examples: Chad, Mozambique, Afghanistan.
- MICs (Middle-Income Countries): GNI per capita between approximately $1,136 and $13,845. This large group is subdivided into lower-middle and upper-middle. Examples: India, Brazil, South Africa, China.
- HICs (High-Income Countries): GNI per capita above approximately $13,846. Concentrated in North America, Western Europe, East Asia, and Australasia. Examples: Germany, Japan, Canada, Australia.
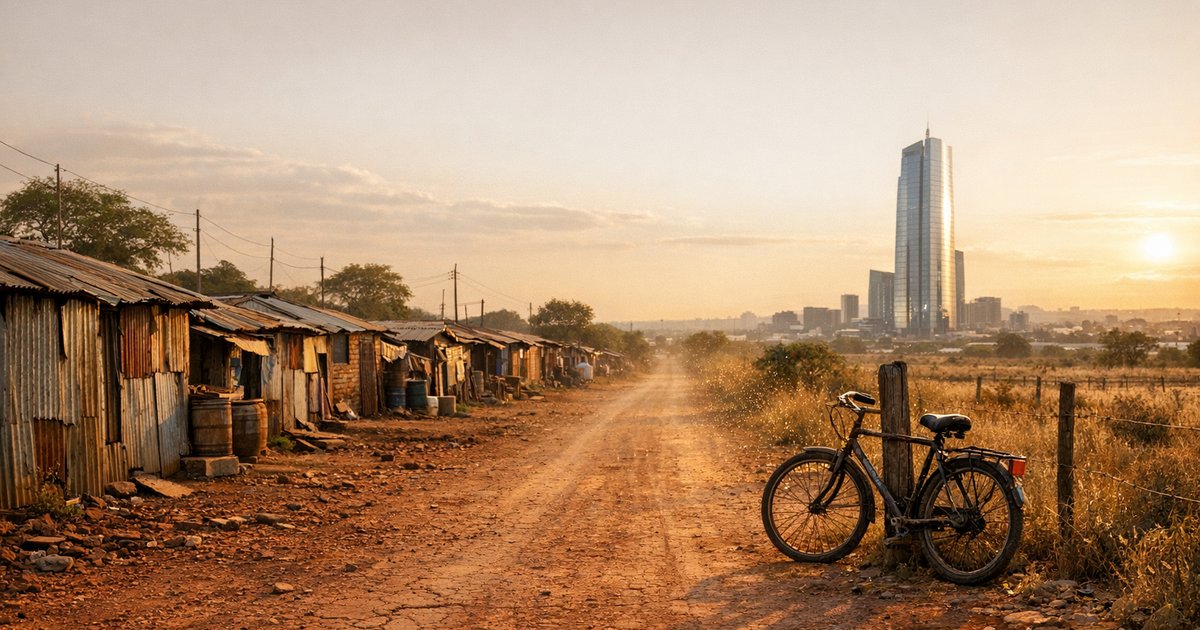
The global pattern shows a clear spatial divide. Most HICs are found in the Northern Hemisphere (with exceptions like Australia and New Zealand). Most LICs are concentrated near the equator and in the Southern Hemisphere.
The Brandt Line
The Brandt Line is a visual model proposed in 1980 that divides the world into the "rich North" and the "poor South." It curves around the globe, placing North America, Europe, Russia, Japan, and Australia/New Zealand in the "North" (developed) category, and most of Africa, South America, and Asia in the "South" (developing) category.
Strengths of the Brandt Line: It provides a simple, memorable visual representation of global inequality. It highlights that development disparities exist at a large scale.
Limitations of the Brandt Line: It is over 40 years old. Since 1980, many countries have shifted categories. China, South Korea, Singapore, and several Middle Eastern states have experienced rapid economic growth that places them firmly in the HIC or upper-MIC bracket. The model also ignores inequality within countries. Treating all of "the South" as uniformly poor is an oversimplification.
Reasons for the Development Gap
Why are some countries wealthier and more developed than others? The syllabus identifies several interconnected factors. I have grouped them into three categories for clarity.
Economic factors:
- Trade disadvantages: many LICs depend on exporting raw materials (coffee, cocoa, minerals) whose prices fluctuate on world markets. HICs export manufactured goods and services with higher, more stable value.
- Debt: many LICs borrowed heavily in the 1970s and 1980s. Interest payments on these debts divert money from healthcare, education, and infrastructure investment.
- Lack of industry: without a strong manufacturing or service sector, economies remain reliant on primary products with low profit margins.
Social factors:
- Poor education systems: low school enrolment, few trained teachers, and limited access to higher education reduce the skilled workforce.
- Disease burden: HIV/AIDS, malaria, and tuberculosis reduce the working-age population and place enormous strain on healthcare budgets.
- Rapid population growth: when population grows faster than economic output, per capita income falls. Resources are spread more thinly.
Environmental factors:
- Natural hazards: countries prone to earthquakes, floods, droughts, or tropical storms face repeated destruction of infrastructure and agriculture.
- Landlocked geography: countries without coastline access face higher transport costs for trade.
- Climate extremes: very hot, very dry, or very wet climates can limit agricultural productivity.
Worked Example 2: Explaining Why a Country Remains an LIC
Question: Explain why some countries remain low-income countries despite having valuable natural resources. [4 marks]
Step-by-step model answer:
- Many LICs export raw materials such as copper, oil, or agricultural products at low prices set by global markets (1 mark).
- These raw materials are processed and manufactured into higher-value products in HICs, which capture the greater share of profit (1 mark).
- Revenue from resource exports is sometimes concentrated among a small elite or affected by corruption, meaning it does not reach the wider population through public services (1 mark).
- Dependence on a single export commodity makes the economy vulnerable to price drops, creating instability that discourages long-term investment in infrastructure and education (1 mark).
Section 3: Achieving Sustainable Development
What Is Sustainable Development?
Sustainable development means meeting the needs of the present generation without compromising the ability of future generations to meet their own needs. For exam purposes, this concept links economic growth, social equity, and environmental protection. A strategy that boosts income today but destroys the environment for tomorrow is not sustainable.
Strategies for Reducing the Development Gap
The IGCSE syllabus names several specific strategies. For each one below, I outline what it is, how it works, and its strengths and limitations.
1. Aid
Aid is the transfer of resources (money, goods, expertise) from one country or organisation to another, intended to promote development.
- Bilateral aid: government to government (e.g., the UK giving aid to Kenya)
- Multilateral aid: channelled through international organisations like the World Bank or the United Nations
- Short-term (emergency) aid: immediate relief after disasters (food, medicine, shelter)
- Long-term (development) aid: projects designed to build capacity (schools, wells, roads)
Strengths: Can save lives in emergencies. Long-term aid can build infrastructure and train local workers. Targets specific needs.
Limitations: Can create dependency if countries rely on aid rather than building their own capacity. Aid is sometimes "tied," meaning the receiving country must buy goods and services from the donor country. Corruption can divert aid away from those who need it most.
2. Trade
Trade allows countries to sell goods and services to generate income. Increasing access to global markets can be a powerful driver of development.
Strengths: Creates employment, generates tax revenue for public services, and builds long-term economic capacity rather than dependence.
Limitations: Many LICs face trade barriers (tariffs and quotas) imposed by HICs. LICs that export primary products face volatile prices. Trade rules set by organisations like the World Trade Organisation (WTO) have historically favoured richer nations.
3. Fair Trade
Fair Trade is a system that guarantees producers in LICs a minimum price for their goods (such as coffee, cocoa, bananas, and cotton), plus a Fair Trade premium that funds community projects.
Strengths: Provides income stability. The premium funds local schools, healthcare, and clean water projects. Promotes sustainable farming practices.
Limitations: Only benefits farmers who are part of Fair Trade cooperatives. The minimum price is still relatively low. Fair Trade products are often more expensive for consumers, which limits their market share.
4. Debt Relief
Debt relief involves cancelling or reducing the debts owed by LICs to HICs, banks, or international organisations. The Heavily Indebted Poor Countries (HIPC) initiative is a notable example.
Strengths: Frees up government revenue that was being spent on interest payments, allowing it to be redirected to healthcare, education, and infrastructure.
Limitations: Does not address the root causes of poverty. Countries may borrow again and accumulate new debt. Relief is sometimes conditional on economic reforms that may not benefit the poorest citizens.
5. Intermediate (Appropriate) Technology
Intermediate technology refers to tools, equipment, and methods that are suited to local conditions, affordable, and maintainable with local skills and materials. Examples include hand pumps for wells, solar-powered lanterns, and clay pot refrigerators.
Strengths: Low cost, easy to repair locally, creates local employment, and is environmentally sustainable. Communities can operate and maintain it without external support.
Limitations: May not produce the scale of output needed for rapid economic growth. Some critics argue it keeps LICs at a lower technological level rather than enabling them to leap forward.
6. Microfinance
Microfinance provides small loans to individuals (often women) who do not have access to traditional banking services. These loans fund small businesses: a market stall, a sewing machine, seeds and tools for farming.
Strengths: Empowers individuals, particularly women. Builds entrepreneurship at the grassroots level. High repayment rates have been demonstrated in many programmes.
Limitations: Loan amounts are small, so economic impact at a national level is limited. Interest rates can be high. Not all micro-businesses succeed, and failure can leave borrowers worse off than before.
7. Tourism
Tourism can generate foreign income, create jobs, and fund infrastructure development in LICs. Countries with natural beauty, wildlife, or cultural heritage can attract international visitors.
Strengths: Creates employment in hotels, restaurants, transport, and guiding. Foreign exchange earnings boost the national economy. Can fund conservation of natural and cultural sites.
Limitations: Jobs are often seasonal and low-paid. Economic leakage occurs when profits flow back to foreign-owned hotel chains rather than staying in the local economy. Tourism can damage fragile environments and disrupt local cultures.
Worked Example 3: Evaluating a Development Strategy
Question: Evaluate the role of microfinance in reducing the development gap. [6 marks]
Step-by-step model answer:
- Define the strategy: Microfinance provides small loans to people in LICs who cannot access traditional bank lending, enabling them to start or expand small businesses (1 mark).
- Explain how it works: A woman in rural Bangladesh, for example, might receive a loan of $100 to buy fabric and a sewing machine, then sell tailored clothing at the local market, using profits to repay the loan and reinvest (1 mark).
- Advantage 1: Microfinance empowers individuals at the grassroots level, building self-sufficiency rather than creating aid dependency (1 mark).
- Advantage 2: It particularly benefits women, who make up the majority of borrowers in most microfinance programmes, improving gender equality alongside economic development (1 mark).
- Disadvantage 1: The scale of individual loans is small, so the impact on national-level development indicators such as GNI per capita is limited (1 mark).
- Disadvantage 2: Interest rates charged by some microfinance institutions can be high, and borrowers who fail to generate enough profit may end up in a cycle of debt rather than escaping poverty (1 mark).
Sustainable Development Goals
The United Nations Sustainable Development Goals (SDGs), adopted in 2015, provide a global framework of 17 goals to be achieved by 2030. They include ending poverty (Goal 1), zero hunger (Goal 2), quality education (Goal 4), clean water and sanitation (Goal 6), affordable and clean energy (Goal 7), and reduced inequalities (Goal 10), among others.
For IGCSE Geography, the key point is that sustainable development requires balancing economic growth, social progress, and environmental protection. A strategy that achieves one at the expense of another is not truly sustainable.
Decision Tree: Choosing the Right Indicator
When an exam question presents data and asks you to assess development, follow this decision process:
- Is only one indicator given? If yes, use it but state its limitations. A single indicator never gives the full picture.
- Are multiple indicators given? If yes, compare them systematically. Do they all point in the same direction, or do they contradict each other?
- Do the indicators conflict? If yes, explain why. For example: "Country Z has a high GNI per capita but a low literacy rate, suggesting that wealth is not being invested in education. This could indicate inequality or government misallocation of resources."
- Is the HDI available? If yes, use it as a summary measure but note that it still uses averages and hides internal disparities.
- Can you identify the country type? Classify as LIC, MIC, or HIC based on the data, and state your reasoning.
Common Mistakes to Avoid
- Using only one indicator to judge development. If the question provides multiple data columns, you must refer to more than one. Ignoring available data costs marks.
- Confusing GDP and GNI. GDP measures production within a country's borders. GNI includes income earned by citizens abroad. They are different measures with different uses.
- Forgetting that infant mortality rate works in reverse. A high infant mortality rate means low development, not high. Triple-check the direction before writing your answer.
- Describing strategies without evaluating them. "Aid helps countries" is description. "Aid can build infrastructure but may create dependency if not managed carefully" is evaluation. The second version scores higher.
- Treating the Brandt Line as current fact. It was proposed in 1980. Many countries have changed category since then. Always acknowledge its limitations when you use it.
- Writing about development strategies without examples. Name a country, a specific project, or a real organisation. Specificity separates strong answers from weak ones.
Self-Check Practice Questions
Use these practice questions to test your understanding. Attempt each in two to four sentences before reviewing the relevant section of these notes.
- Define "quality of life" and explain how it differs from "standard of living."
- A country has a GNI per capita of $950, an infant mortality rate of 72 per 1,000, and a literacy rate of 48%. Classify this country as an LIC, MIC, or HIC, and justify your answer using all three indicators.
- State two strengths and two limitations of using GNI per capita as a development indicator.
- Explain what the Brandt Line shows and give two reasons why it is considered outdated.
- Describe three economic factors that can cause a country to remain less developed.
- Compare the advantages and disadvantages of aid versus trade as strategies for reducing the development gap.
- Explain how intermediate technology can promote sustainable development in an LIC, using a named example.
- What is the HDI, and why is it considered a better measure of development than GNI per capita alone?
Connecting the Three Sub-Sections
Development is not three separate topics. The sub-sections connect tightly. You need indicators (Section 1) to measure and identify the gap. You need spatial patterns and causes (Section 2) to explain why the gap exists. And you need strategies (Section 3) to demonstrate how the gap might be reduced.
The strongest exam answers link across these sections. For example: "Mozambique classifies as an LIC with a GNI per capita below $500 and an infant mortality rate above 60 per 1,000. Contributing factors include its vulnerability to tropical cyclones, reliance on primary agricultural exports, and the burden of debt from past borrowing. Strategies such as debt relief and the adoption of intermediate technology for agriculture could help address these specific constraints."
That single paragraph references indicators, identifies causes, and proposes targeted solutions. It is the type of integrated thinking that the Cambridge IGCSE Geography exam rewards. Once the logic of IGCSE 0460 Development is explained and practised this way, you will be well prepared for any development question the paper sets.

A structured revision guide to Development for IGCSE Geography (0460), covering measuring development with indicators, uneven global development patterns, and strategies for reducing the development gap, with worked examples and self-check questions.




Àsìkò méjì (Comment(s))