A Global Story Told in Ice and Air
In the archives of the University of Bern, scientists have extracted ice cores from Antarctica that preserve atmospheric records stretching back 800,000 years. In the fishing villages of Bangladesh, families have watched the waterline creep closer to their doorsteps within a single generation. Climate change connects the deep geological past to the lived present, and it operates at every geographic scale, from the planetary tilt of Earth's orbit to the flooded rice paddies of Southeast Asia.
For Cambridge IGCSE Geography (0460), this topic requires you to think across time and space. You need to explain what causes the climate to change naturally, how human activity has accelerated that change, and what responses exist at local, national, and international levels. These revision notes follow the syllabus objectives closely, building from evidence and causes through to impacts and strategies.
Section 1: Evidence That Climate Is Changing
Before examining causes, you must be able to identify and explain the evidence that Earth's climate has shifted over time. The syllabus specifies four key types of evidence.
Global Temperature Data
Instrumental records kept since the mid-nineteenth century show a clear upward trend in global average surface temperatures, with the sharpest rise occurring since the 1970s. The global mean temperature has increased by approximately 1.1 degrees Celsius above pre-industrial levels. Temperature datasets compiled by agencies such as NASA and the UK Met Office confirm that the warmest years on record have all occurred since 2000. This is the most direct and widely cited evidence for recent climate change.
Ice Cores
Ice cores drilled from polar ice sheets in Greenland and Antarctica trap tiny air bubbles that preserve samples of the ancient atmosphere. By analysing the composition of these bubbles, scientists can reconstruct past levels of carbon dioxide, methane, and temperature going back hundreds of thousands of years. The data reveal a strong correlation: periods of higher CO2 concentration align with warmer global temperatures, and periods of lower CO2 align with ice ages. The Vostok ice core from Antarctica, for example, covers approximately 420,000 years and shows this pattern across four glacial-interglacial cycles.
Sea Ice Positions
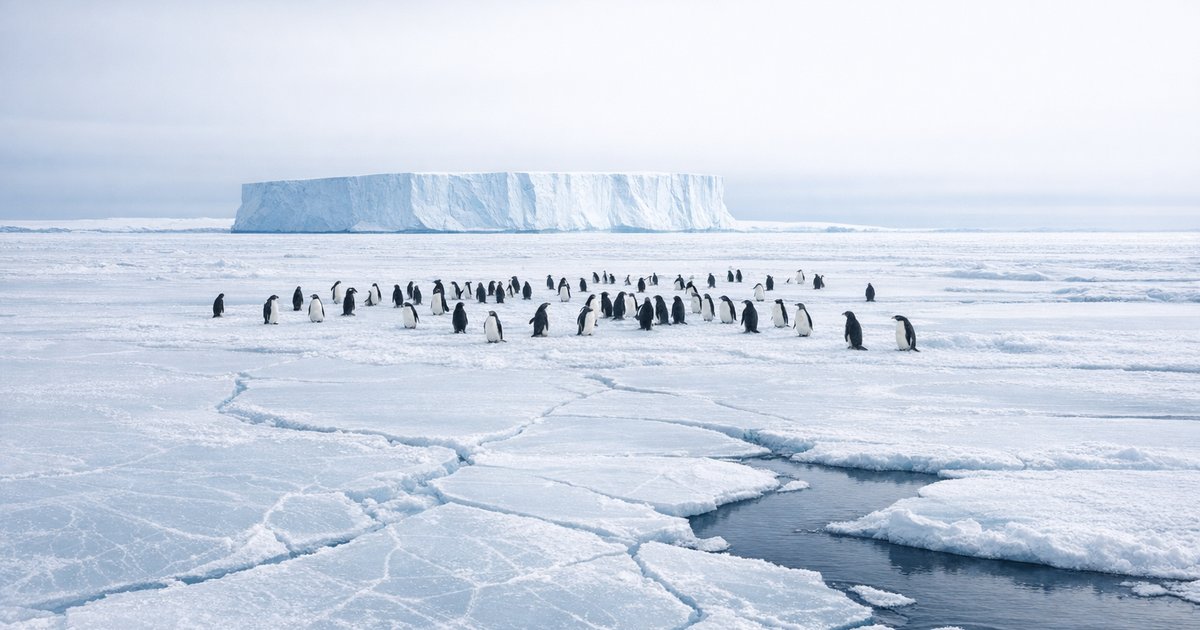
Satellite imagery since the late 1970s tracks the extent of Arctic and Antarctic sea ice. Arctic summer sea ice extent has declined by roughly 13 percent per decade. In September 2012, Arctic sea ice reached its lowest recorded extent: 3.41 million square kilometres, about half of the 1979-2000 average. The retreat of sea ice is both evidence of warming and a contributor to further warming through the ice-albedo feedback effect (exposed dark ocean absorbs more solar radiation than reflective white ice).
Historic Writing and Paintings
Before scientific instruments existed, humans recorded climate conditions in other ways. Medieval chronicles describe the "Medieval Warm Period" (roughly 900 to 1300 CE), during which vineyards flourished in southern England and Norse settlers farmed in Greenland. Paintings from the seventeenth and eighteenth centuries depict "frost fairs" on the frozen River Thames in London during the "Little Ice Age." Dutch landscape painters such as Hendrick Avercamp captured frozen canals that rarely freeze today. These records are less precise than instrumental data, but they confirm that climate has always varied and provide a human-scale perspective on change.
Section 2: Natural Causes of Climate Change
The Cambridge IGCSE syllabus identifies three natural mechanisms that cause long-term climate variation. Each operates on a different timescale and through a different physical process.
Orbital Changes (Milankovitch Cycles)
The Serbian scientist Milutin Milankovitch proposed in the early twentieth century that slow, predictable changes in Earth's orbit around the Sun alter the amount and distribution of solar energy reaching the planet. Three cycles interact:
- Eccentricity (approximately 100,000-year cycle): the shape of Earth's orbit shifts between more circular and more elliptical, changing the distance from the Sun at different times of year.
- Axial tilt (approximately 41,000-year cycle): the angle of Earth's axis varies between about 22.1 and 24.5 degrees, affecting the intensity of seasons. A greater tilt produces more extreme summers and winters.
- Precession (approximately 26,000-year cycle): Earth's axis wobbles like a spinning top, changing which hemisphere is tilted towards the Sun at perihelion (closest orbital approach).
Together, these cycles explain the timing of ice ages and interglacial warm periods over the past two million years. They do not, however, explain the rapid warming of the last 150 years, because orbital changes operate far too slowly.
Sunspots
Sunspots are dark patches on the Sun's surface associated with higher solar energy output. The number of sunspots follows an approximately 11-year cycle. During periods of high sunspot activity, slightly more solar radiation reaches Earth. The "Maunder Minimum" (approximately 1645 to 1715), a period of almost no sunspot activity, coincided with some of the coldest decades of the Little Ice Age in Europe. The variation in solar output due to sunspots is small, roughly 0.1 percent, enough to influence climate over decades but insufficient to account for the scale of modern warming.
Volcanic Activity
Major volcanic eruptions inject huge quantities of ash and sulfur dioxide into the stratosphere. These particles reflect incoming solar radiation back into space, creating a temporary cooling effect. The 1991 eruption of Mount Pinatubo in the Philippines reduced global temperatures by approximately 0.5 degrees Celsius for about two years. The 1815 eruption of Tambora in Indonesia caused 1816 to be known across Europe and North America as the "Year Without a Summer," with crop failures and food shortages.
Volcanic cooling is significant but short-lived. Particles settle out of the atmosphere within a few years, so volcanism drives temporary climate fluctuations rather than long-term trends.
Section 3: The Enhanced Greenhouse Effect
The natural greenhouse effect is essential for life: gases such as water vapour, carbon dioxide, and methane trap outgoing infrared radiation, keeping Earth's average surface temperature at roughly 15 degrees Celsius rather than the minus 18 degrees it would be without them. The problem is not the greenhouse effect itself. The problem is human activity intensifying it.
How Human Activities Enhance the Greenhouse Effect
Three categories of human activity are specified by the IGCSE syllabus:
| Human Activity | Greenhouse Gas Produced | How It Contributes |
|---|---|---|
| Burning fossil fuels (coal, oil, natural gas) | Carbon dioxide (CO2) | Combustion releases carbon stored in fossil fuels over millions of years. Transport, industry, and power generation are the largest sources. CO2 concentration has risen from approximately 280 ppm pre-industrial to over 420 ppm. |
| Deforestation | Carbon dioxide (CO2) | Trees absorb CO2 during photosynthesis. When forests are cleared (especially by burning), stored carbon is released. The loss of trees also reduces the planet's capacity to absorb future CO2. |
| Agriculture | Methane (CH4) and nitrous oxide (N2O) | Rice paddies and livestock (especially cattle) produce methane through anaerobic decomposition and digestive processes. Fertiliser use releases nitrous oxide. Methane is roughly 80 times more potent than CO2 over a 20-year period. |
The mechanism is straightforward: more greenhouse gases in the atmosphere trap more outgoing infrared radiation, raising global temperatures. This is the enhanced greenhouse effect, distinguished from the natural process by its human origin and its unprecedented speed.
Worked Example 1: Explaining the Enhanced Greenhouse Effect
Question: Explain how the burning of fossil fuels contributes to the enhanced greenhouse effect. [4 marks]
Model answer, step by step:
- Fossil fuels such as coal, oil, and natural gas contain carbon that was stored underground over millions of years (1 mark).
- When burned for energy in power stations, vehicles, and factories, this carbon combines with oxygen to form carbon dioxide, which is released into the atmosphere (1 mark).
- Carbon dioxide is a greenhouse gas that absorbs outgoing infrared (longwave) radiation from the Earth's surface and re-emits it back towards the ground (1 mark).
- The increased concentration of CO2 (from approximately 280 ppm to over 420 ppm since pre-industrial times) means more heat is trapped, raising global temperatures beyond the natural greenhouse level (1 mark).
Section 4: Impacts of Climate Change
The IGCSE syllabus requires you to understand both present-day and predicted future impacts. What makes this section demanding is the need to think across geographic scales: some impacts are global, some regional, and some devastatingly local.
Rising Sea Levels
Sea levels rise for two reasons: thermal expansion (warmer water occupies more volume) and the melting of land-based ice (glaciers and ice sheets in Greenland and Antarctica). Global mean sea level has risen by approximately 20 centimetres since 1900 and is projected to rise by a further 0.3 to 1.0 metre by 2100, depending on emissions pathways.
The consequences vary dramatically by location. For the Maldives, where 80 percent of the land sits less than one metre above sea level, even modest rises threaten national survival. For the Netherlands, a country with centuries of experience in water management, the challenge is expensive but familiar. For coastal megacities from Jakarta to Lagos, the combination of subsidence and rising seas creates urgent risks for millions of residents. Bangladesh is particularly vulnerable: a one-metre rise could flood roughly 17 percent of the country's land area and displace tens of millions of people.
Changes to Global Temperature and Weather Patterns
Rising temperatures alter the behaviour of weather systems globally. The consequences include:
- More frequent and intense heatwaves: southern Europe, the Middle East, and South Asia have experienced record-breaking temperatures in recent years, with direct consequences for health, agriculture, and water supply.
- Shifting precipitation patterns: some regions receive more rainfall and face increased flood risk, while others experience prolonged droughts. The Sahel region of Africa, already marginal for agriculture, faces unpredictable rainfall that disrupts planting seasons.
- More powerful tropical storms: warmer ocean surface temperatures provide more energy to hurricanes and typhoons. While the total number of storms may not increase, their peak intensity is projected to rise.
- Melting permafrost: in Arctic regions such as Siberia and northern Canada, thawing permafrost releases stored methane (a potent greenhouse gas), creates a positive feedback loop, and destabilises infrastructure built on formerly frozen ground.
Changes to Food Production
Agriculture is profoundly sensitive to temperature and rainfall patterns. The impacts are not uniform:
- In tropical and subtropical regions, higher temperatures may reduce yields of staple crops such as rice, maize, and wheat. Parts of sub-Saharan Africa could see crop yields fall by 20 to 30 percent by 2050.
- In higher-latitude regions, longer growing seasons and warmer temperatures may initially increase agricultural productivity. Southern Scandinavia and parts of Canada could see expanded arable land.
- Extreme weather events (droughts, floods, storms) can destroy harvests in a single season, with cascading effects on food prices and food security, particularly in countries that import a large share of their grain.
Worked Example 2: Impacts at Different Scales
Question: Describe the impacts of rising sea levels at different geographic scales. [6 marks]
Model answer, step by step:
- Global scale: Sea levels are rising worldwide due to thermal expansion of ocean water and the melting of ice sheets in Greenland and Antarctica (1 mark). This affects all coastal nations, with projected rises of 0.3 to 1.0 metre by 2100 (1 mark).
- National scale: Low-lying island nations such as the Maldives face existential threats, as the majority of their land area is less than one metre above sea level (1 mark). Bangladesh could lose approximately 17 percent of its land area, displacing tens of millions (1 mark).
- Local scale: Individual communities face saltwater intrusion into freshwater aquifers, destroying drinking water supplies and agricultural land (1 mark). Coastal erosion accelerates, threatening homes, roads, and businesses in specific settlements (1 mark).
Section 5: Responses to Climate Change
Responses to climate change fall into two broad categories: mitigation (reducing the causes) and adaptation (adjusting to the consequences). The IGCSE syllabus expects you to know both, along with specific national and international agreements.
Mitigation Strategies
Mitigation aims to reduce greenhouse gas emissions or increase carbon absorption.
- Renewable energy: transitioning from fossil fuels to solar, wind, hydroelectric, and geothermal energy. Germany's Energiewende (energy transition) policy has driven renewables to supply over 40 percent of the country's electricity.
- Carbon capture and storage (CCS): technology that captures CO2 from industrial sources before it enters the atmosphere and stores it underground. Norway's Sleipner project has been injecting CO2 into a deep saline aquifer beneath the North Sea since 1996.
- Afforestation and reforestation: planting new forests or restoring degraded ones to absorb CO2. China's "Great Green Wall" project has planted billions of trees across the northern provinces to combat desertification while sequestering carbon.
- Reducing deforestation: programmes like REDD+ (Reducing Emissions from Deforestation and Forest Degradation) provide financial incentives to developing countries that protect their forests.
- Energy efficiency: improving insulation in buildings, developing more fuel-efficient vehicles, and reducing industrial energy waste all lower emissions without requiring a complete energy source switch.
Adaptation Strategies
Adaptation accepts that some degree of climate change is now unavoidable and focuses on reducing vulnerability.
- Sea defences: the Netherlands has invested in the Delta Works and Maeslantkering storm surge barrier. The Thames Barrier protects London from tidal flooding. These are expensive, engineered solutions suited to wealthy nations.
- Drought-resistant crops: agricultural scientists have developed crop varieties that tolerate higher temperatures and lower water availability. In parts of East Africa, drought-tolerant maize has been distributed to smallholder farmers.
- Water management: improving irrigation efficiency, building reservoirs, and implementing rainwater harvesting systems. Israel's drip irrigation technology, now exported worldwide, uses up to 50 percent less water than conventional methods.
- Urban planning: designing cities to cope with extreme heat (green roofs, reflective surfaces, expanded urban tree canopy) and flooding (permeable pavements, sustainable urban drainage systems).
- Early warning systems: improved weather forecasting and flood warning systems give communities time to prepare and evacuate, reducing loss of life from extreme weather events.
International Agreements
Climate change is a global problem that no single country can solve alone. International cooperation has produced several landmark agreements:
| Agreement | Year | Key Features |
|---|---|---|
| Kyoto Protocol | 1997 | First legally binding international treaty to reduce greenhouse gas emissions. Set targets for industrialised nations only. Some major emitters (the USA) did not ratify it. |
| Paris Agreement | 2015 | Signed by 196 countries. Aims to limit global temperature rise to well below 2 degrees Celsius above pre-industrial levels, with efforts to limit it to 1.5 degrees. Each country sets its own nationally determined contributions (NDCs). Reviewed every five years. |
The Paris Agreement is significant because it brought both developed and developing nations into a shared framework. Its limitation is that NDCs are voluntary and not legally enforceable: countries set their own targets and are not penalised for missing them. Many analysts have noted that current pledges, even if fully met, would still result in warming well above 1.5 degrees Celsius.
Worked Example 3: Evaluating a Response Strategy
Question: Evaluate the effectiveness of international agreements in managing the impacts of climate change. [6 marks]
Model answer, step by step:
- International agreements such as the Paris Agreement (2015) bring nearly 200 countries together to set emission reduction targets, creating a shared framework for action (1 mark).
- The Paris Agreement's goal of limiting warming to 1.5 degrees Celsius provides a clear benchmark against which progress can be measured (1 mark).
- The agreement has encouraged many countries to invest in renewable energy and set net-zero targets, accelerating the transition away from fossil fuels (1 mark).
- A key weakness is that nationally determined contributions are voluntary: no country faces penalties for failing to meet its pledges (1 mark).
- Current pledges collectively fall short of the 1.5 degree target, with projections suggesting warming of 2.5 to 3.0 degrees Celsius under present commitments (1 mark).
- Developing countries argue that HICs, which are historically responsible for the majority of cumulative emissions, should bear a greater share of the costs. Disputes over climate finance have slowed progress at successive COP summits (1 mark).
Connecting Natural and Human Causes: The Full Picture
A well-prepared IGCSE candidate understands that climate has always changed naturally, but that the current rate and trajectory are driven overwhelmingly by human activity. The Milankovitch cycles explain glacial and interglacial periods over tens of thousands of years. Volcanic eruptions cause temporary cooling. Sunspot cycles produce minor fluctuations. None of these natural factors can account for the rapid, sustained warming observed since the mid-twentieth century, during which atmospheric CO2 has surged from 315 ppm (1958, when Charles David Keeling began his measurements at Mauna Loa) to over 420 ppm today.
The ability to distinguish natural variability from human-driven change is a mark of geographical thinking that examiners consistently reward. When you answer an IGCSE question on the causes of climate change, present both natural and human factors, then explain why scientists attribute recent warming primarily to the enhanced greenhouse effect.
Common Mistakes to Avoid
- Confusing the greenhouse effect with the enhanced greenhouse effect. The natural greenhouse effect keeps Earth habitable. The enhanced greenhouse effect is the human-caused intensification. Use the correct term.
- Claiming that volcanoes cause global warming. Their dominant short-term effect is cooling through particulate reflection. Volcanic CO2 emissions are negligible compared to anthropogenic sources.
- Mixing up mitigation and adaptation. Planting trees to absorb CO2 is mitigation. Building a sea wall to protect against rising seas is adaptation. Label each strategy correctly.
- Vague impact descriptions. "Climate change is bad for the environment" earns no marks. Specify what changes, where, and with what consequence. Use named places and data where possible.
- Ignoring scale. Impacts and responses differ by geographic scale. A response that works for the Netherlands (engineered flood barriers) may not work for Bangladesh (insufficient funds for large-scale infrastructure). Always specify the context.
- Writing about only one side of an evaluation. If the question says "evaluate," you must present both strengths and limitations of a strategy or agreement. One-sided answers cannot access the highest mark bands.
Self-Check Practice Questions
Test yourself with these questions. Write your answer in two to four sentences, then review the relevant section above.
- Name and describe two types of evidence for climate change, giving a specific example for each.
- Explain how Milankovitch cycles influence Earth's climate. Why can they not explain recent global warming?
- Describe the enhanced greenhouse effect and explain how deforestation contributes to it.
- Using a named example, explain how rising sea levels could affect a low-lying country.
- Distinguish between mitigation and adaptation. Give one example of each.
- Evaluate the effectiveness of the Paris Agreement as a strategy for managing climate change.
- Explain how climate change could have both positive and negative effects on food production in different parts of the world.
- A government is deciding between investing in renewable energy or building sea defences. Explain the advantages and disadvantages of each approach.
Thinking Across the Topic
Climate change in IGCSE Geography is not a single, isolated unit. It connects to population and settlement (climate refugees), to economic activity (fossil fuel dependence), to ecosystems (coral bleaching, habitat loss), and to development (the most vulnerable nations are often the least responsible for emissions). The strongest exam answers draw these connections explicitly. A candidate who can link the enhanced greenhouse effect to food insecurity in sub-Saharan Africa, then evaluate whether international aid or local adaptation is the more effective response, demonstrates exactly the integrated geographical reasoning that the Cambridge IGCSE mark scheme rewards.
Across every section of these notes, the same principle holds: specific evidence, named examples, and balanced evaluation are what separate competent answers from excellent ones. Climate change is a topic that rewards students who think globally while writing precisely.

A thorough revision guide to Climate Change for Cambridge IGCSE Geography (0460), covering natural and human causes, global-to-local impacts, and mitigation and adaptation strategies, with worked examples and self-check questions.


Comentario(s)